PeaceTech Lab
Data science for local visibility into emerging economies.
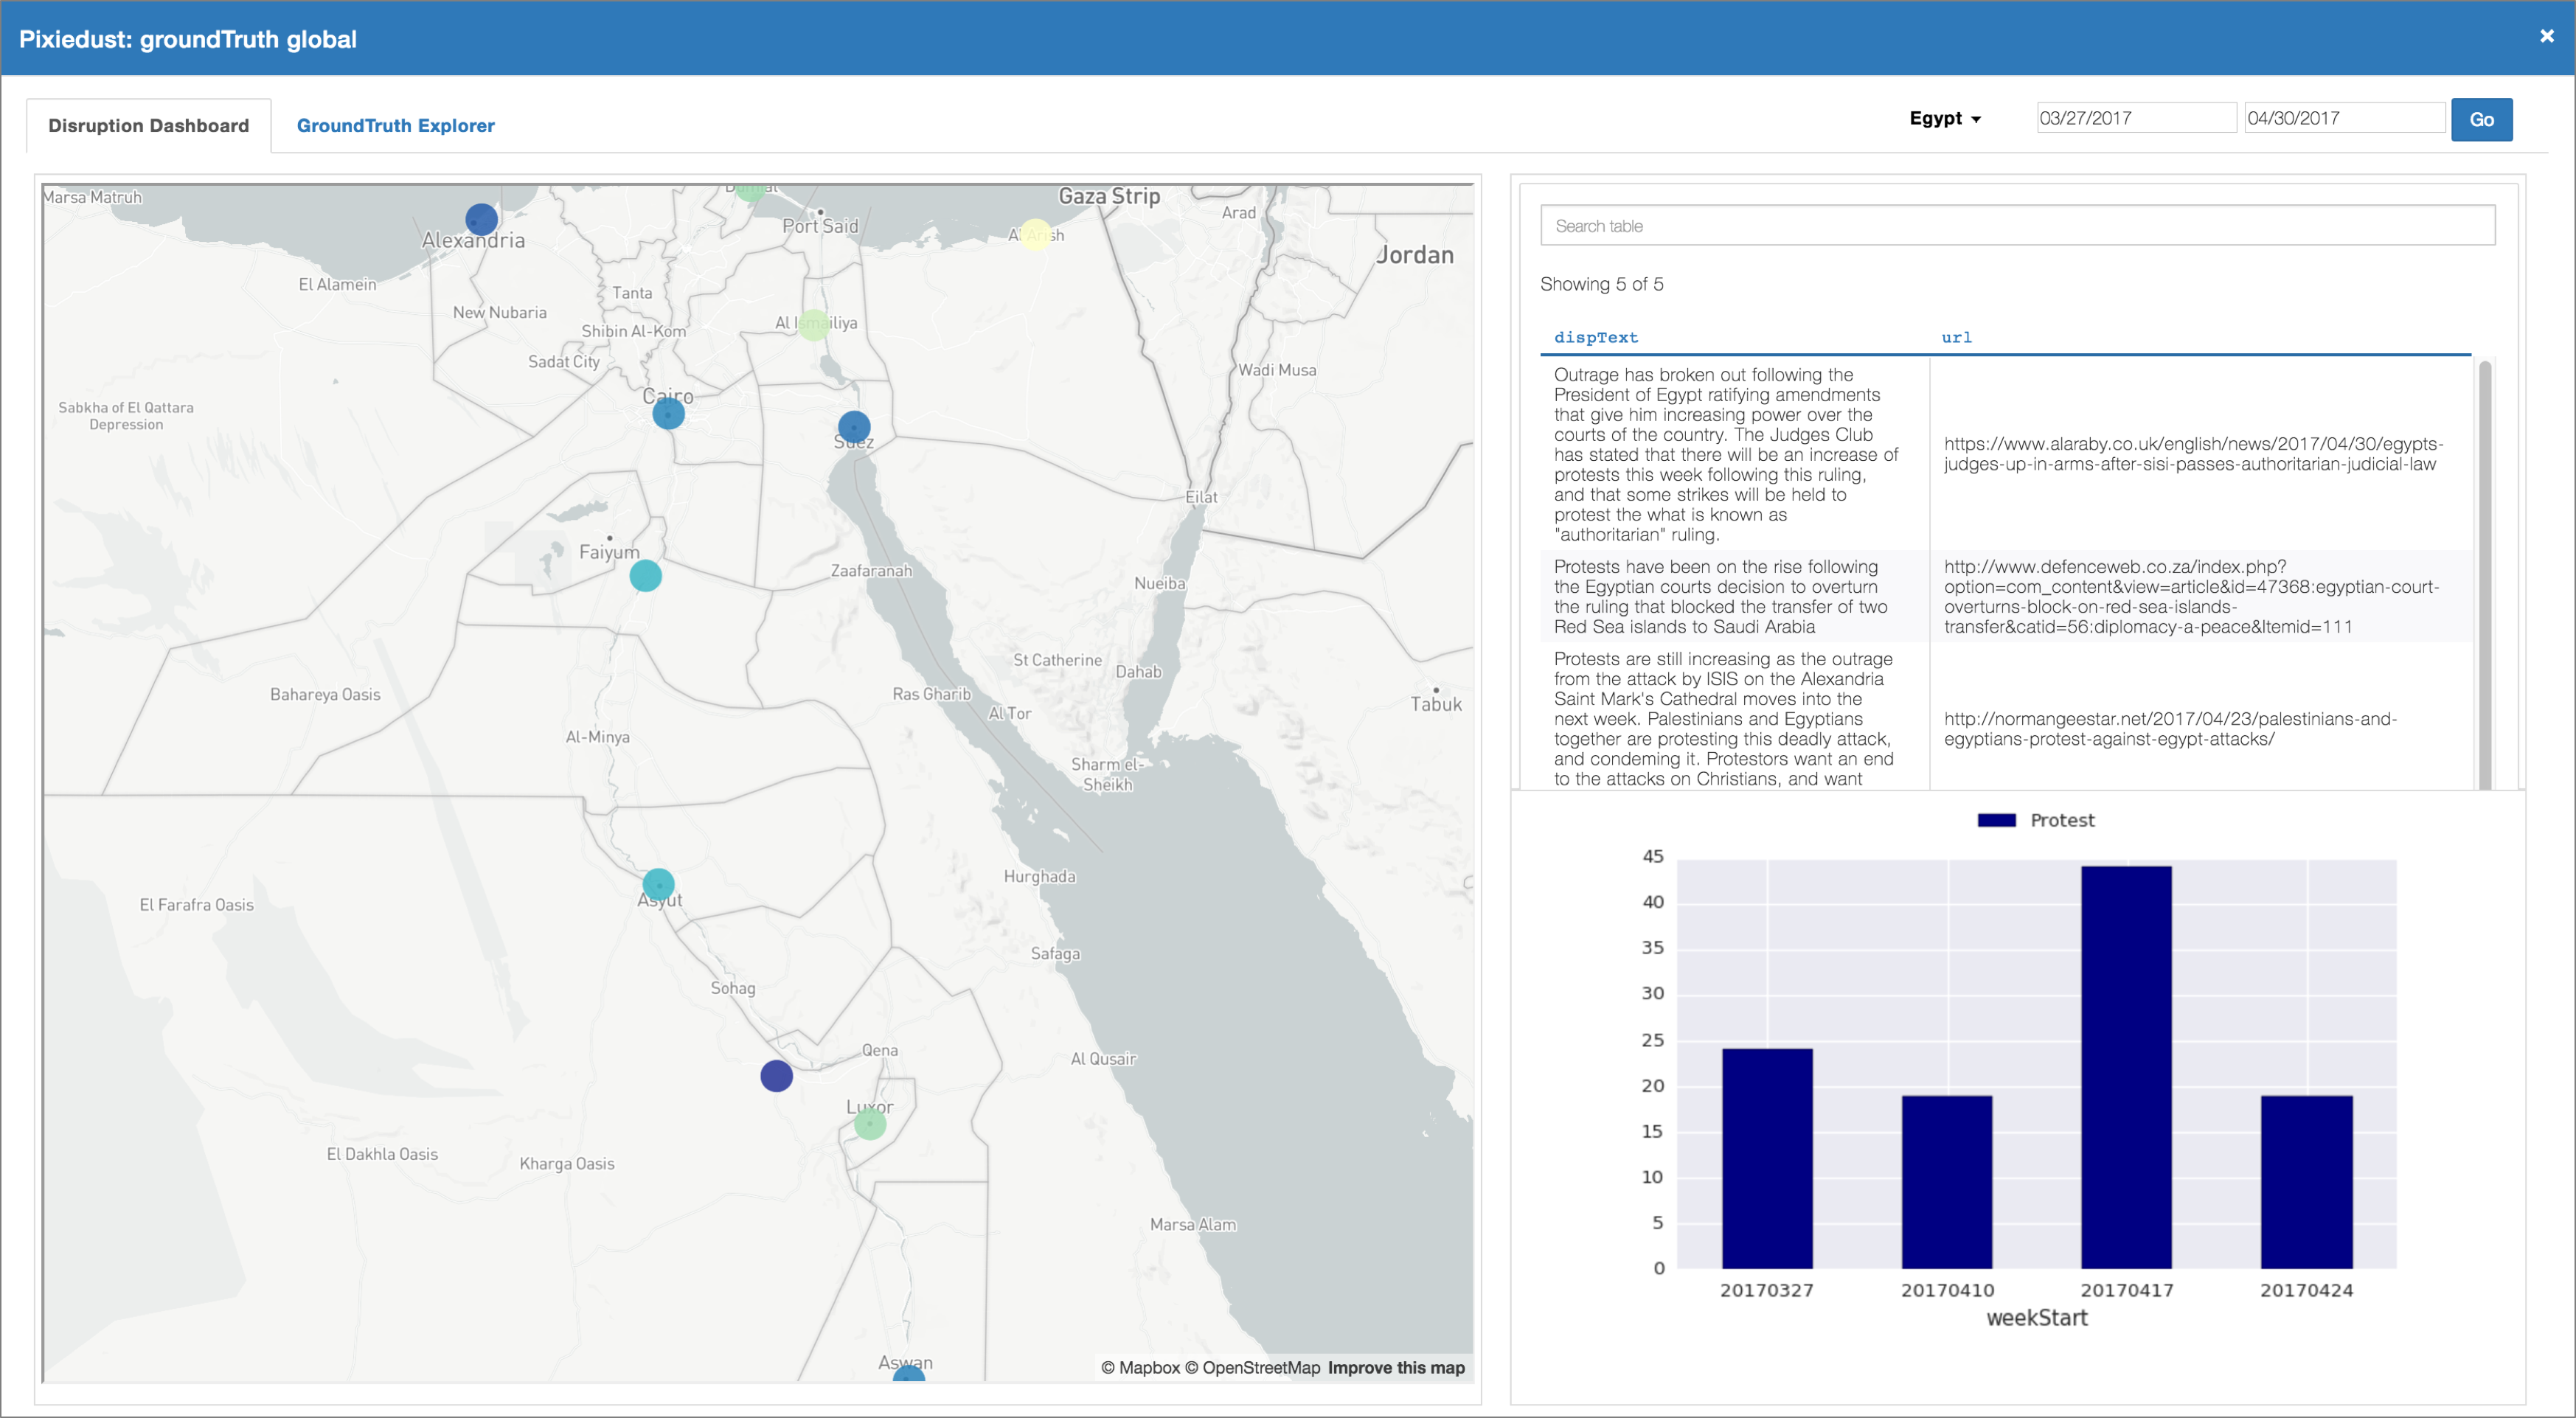
The pixiedust_peacetech project
PeaceTech Lab is a nonprofit that collects data from areas of geopolitical instability around the globe. The data is varied, with formats ranging from social media images, to satellite activity, to written reports. It synthesizes this information into machine learning models that can indicate the relative stability of communities in conflict areas, with the ultimate goal of enabling other organizations and entrepreneurs to build life-saving tech for the people who need it most.
In packaging this data to potential users, PeaceTech faced a user interface challenge: what was the best way to refine and condense all these stability indicators into a web dashboard? That’s where IBM could help.
A data science UI problem
For the data refinement aspect, data science notebooks were an obvious fit. With open source tools like PixieDust, data visualization in Python Jupyter Notebooks becomes a quick, interactive process. While it simplified the amount of Matplotlib code required, it did little to address the dashboard piece.
The team at IBM Watson Data Lab could have built a classic multi-tier Node.js application, but it would cost a lot of time and effort given the fast iteration required. Instead, the team decided to use PixieDust and build a new concept called PixieApps that would allow PeaceTech to iterate quickly on the UI, right alongside their data.
PixieApps
Most PixieApps are simply HTML and CSS, with a small amount of Python. First, import PixieDust into a Jupyter Notebook cell:
From there, simply define your UI’s view:
Then, add your data and run your app:
That’s it. See the work in this collection for more on PixieApps and how PeaceTech applied the tool to their data refinement-and-dashboarding problem.
Projects
-
pixiedust_peacetech
GitHubLocal visibility to mitigate business disruption in emerging economies.